- Topic1/3
37k Popularity
25k Popularity
43k Popularity
8k Popularity
21k Popularity
- Pin
- 🎉 The #CandyDrop Futures Challenge is live — join now to share a 6 BTC prize pool!
📢 Post your futures trading experience on Gate Square with the event hashtag — $25 × 20 rewards are waiting!
🎁 $500 in futures trial vouchers up for grabs — 20 standout posts will win!
📅 Event Period: August 1, 2025, 15:00 – August 15, 2025, 19:00 (UTC+8)
👉 Event Link: https://www.gate.com/candy-drop/detail/BTC-98
Dare to trade. Dare to win.
- 🎉 Gate Square Growth Points Summer Lucky Draw Round 1️⃣ 2️⃣ Is Live!
🎁 Prize pool over $10,000! Win Huawei Mate Tri-fold Phone, F1 Red Bull Racing Car Model, exclusive Gate merch, popular tokens & more!
Try your luck now 👉 https://www.gate.com/activities/pointprize?now_period=12
How to earn Growth Points fast?
1️⃣ Go to [Square], tap the icon next to your avatar to enter [Community Center]
2️⃣ Complete daily tasks like posting, commenting, liking, and chatting to earn points
100% chance to win — prizes guaranteed! Come and draw now!
Event ends: August 9, 16:00 UTC
More details: https://www
2100NEWS WEEKLY CRYPTO REPORT Jul-25
The crypto index NWST1100 posted a marginal gain of just +0.15% last week. Coins represented by the NWSCo100 index have outperformed other segments, surging by 17.83% in the previous thirty days.
*Below, we present a standardized weekly report and next week’s outlook, prepared based on the Theory Swingtum of intelligent finance. We gauge the crypto market’s breadth and direction by showing charts 2100NEWS Digital Assets Total Index (NWST1100), which measures 1100 (by market capitalization) significant crypto assets’ performance. The information-laden chart is complex to read initially, but it effectively displays essential price information, crucial decisive price levels, momentum, trading volumes, and crypto market breadth. Monitoring Market Sentiment and Breadth is necessary to detect early signs of trend reversals or continued strength.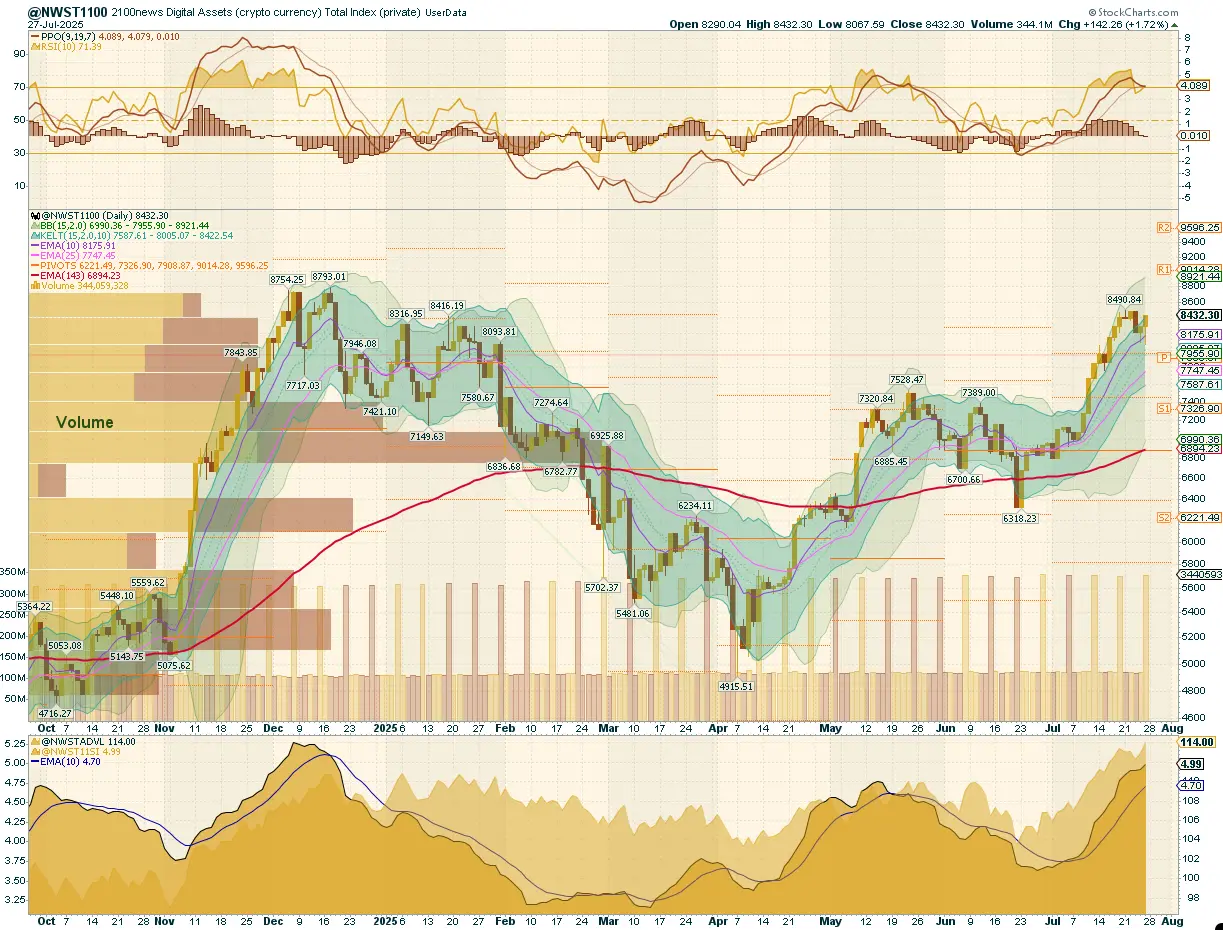
After conducting a detailed examination of the NWST1100 chart, a vital metric for the cryptocurrency market, reveals several essential market dynamics and changes in market sentiment:
The NWST1100: Following a parabolic surge in early July, the NWST1100 posted a marginal gain of just +0.15% last week, indicating a cooling phase and possible consolidation. After an aggressive altcoin-led breakout, momentum has decelerated, with price action flattening, a typical post-extension digestion pattern. While Ethereum (ETHUSD) remains the standout performer with a 59% gain over the past month, the intensity of the catch-up rally has tapered. Altcoin indices, such as NWSCo100 and NWSET100, continued to lead, while Bitcoin and hybrid indices, like NWSBE, lagged, confirming that a structural capital rotation toward altcoins and the Ethereum ecosystem is ongoing.
Market Sentiment (PPO & RSI): Momentum indicators now reflect this slowdown. The PPO histogram has declined to the zero line, and the PPO itself has turned downward, signaling a loss of upward momentum. Meanwhile, the RSI remains elevated at 71, firmly in overbought territory. While this confirms the underlying trend’s strength, it also points to growing exhaustion and an increased potential for a short-term pullback.
Crypto Market Breadth indicators at the bottom of the chart, while still positive, showed signs of saturation. The Advance-Decline Line (ADL) and the McClellan Summation Index rose modestly, but both indicators stalled midweek before resuming their advance at a much slower pace by week’s end. This suggests continued participation in the rally, but with waning intensity — a typical hallmark of a maturing impulse move.
In summary, the crypto market has entered a constructive consolidation phase following its most powerful rally in months. Breadth remains supportive but stretched, and momentum is fading. The structural rotation into altcoins is still intact, but caution is warranted as the index approaches critical resistance levels, where profit-taking or mean reversion could emerge.
According to the chart on the right, A50R indicators across all four market segments (NWST1100, NWSET100, NWSL100, NWSCo100)reveal the structural rotation that has unfolded into altcoins and the Ethereum ecosystem:
This breadth indicator measures the percentage of digital assets trading above a 50-day moving average
* The percentage of digital assets trading above a specific moving average is a breadth indicator that measures internal strength or weakness in the underlying index. The chart on the right side compares the percentage of DA trading above the 50-day EMA for:
Outlook for this week
This report examines the cryptocurrency market’s short-term outlook, identifying patterns and signals that may offer insights into potential market direction. While predicting market behavior is inherently uncertain, discernible trends in momentum and market breadth indicators suggest possible developments.
In conclusion, following the explosive altcoin-driven breakout, the market has entered a cooling phase. Momentum is fading, and participation, while still supportive, is showing early signs of saturation. The more probable scenario over the coming days is a volatile sideways range between key resistance and support zones The NWST1100 index may attempt to retest resistance between 8,600 and 9,040 (Point & Figure target and Pivot R1). However, under current stretched conditions, a clean breakout appears unlikely. If resistance holds — as is statistically probable — a sharp retracement toward the 8,000 area is expected. This zone aligns with both the 25-day EMA and Pivot P, offering a likely short-term technical floor Instead of anticipating strong directional continuation, traders should brace for whipsaw price action, elevated volatility, and fading momentum — particularly during tests of both resistance and support extremes.
📍 Key levels to watch:
Resistance: 8600 (Point & Figure chart, bullish price objective), 8,800 (previous highs from December), 9040 Pivot R1
Support: 7,920 (Pivot P)
Performance of different groups of Digital Assets (Coins and Tokens)
Investors and traders often rely on historical performance data to make informed decisions about their cryptocurrency holdings. After analyzing the data in the table, it can be seen that the crypto market stalled, and the overall index has marginally increased by 0.15% over the last week.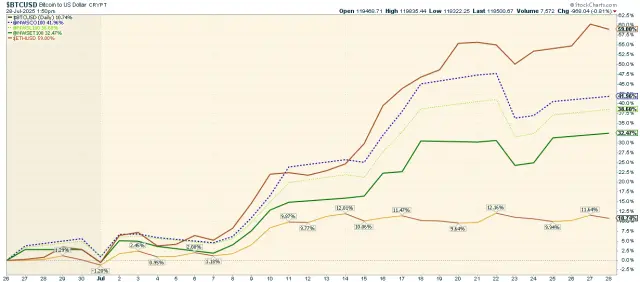 The chart above highlights the performance of various cryptocurrencies, including Bitcoin, Ether, and the 2100NEWS Indices, which represent the performance of Ethereum-based tokens (NWSET100), large caps (NWSL100), and Coins (NWSCo100). Among these, Ether stood out, significantly outperforming other segments with a remarkable 59.00% gain over the past thirty days.
While the broader market has flattened, different segments and individual cryptocurrencies exhibit different performance dynamics.
Performance Trends by Market Segment:
✔ Ether, NWSET100 (Ethereum-based tokens), NWSCo100 (Coins), and NWSL100 (Large Caps) led the market**,**
✔ NWSBE, Bitcoin, and NWS30 lagged, underperforming relative to the broader rally.
Investors and traders might use this information to adjust their portfolios, possibly shifting focus toward assets with stronger relative momentum while being cautious about those in the Weakening quadrant.
*RRG® charts show the relative strength and momentum of groups of digital assets. Those with strong relative strength and momentum appear in the green Leading quadrant. As relative momentum fades, they typically move into the yellow Weakening quadrant. If relative strength then fades, they move into the red Lagging quadrant. Finally, when momentum picks up again, they shift into the blue Improving quadrant.
Crypto (Digital Assets) compared with global equity
This report offers a comprehensive analysis comparing the performance of digital assets, as signified by the NWST1100 index, to shares on global capital markets, as represented by the Dow Jones Global W1Dow index. The comparison spans various timeframes, providing insights into both historical and recent performances, as well as potential future trends.
Let’s break down the key observations and implications:
The recent rally highlights the importance of tracking market swings. Historically, the best opportunities have emerged when sentiment was weakest and prices were below the 143-day EMA. Conversely, when the market rallies strongly and stretches far above the 143-day EMA, as now, it is often prudent to start building cash reserves to take advantage of future pullbacks.
*The box in the middle of the chart shows the original NWST1100 price; at the bottom is W1Dow